

What is it, and where would you look? How we organise 600,000 listings.
Before you can browse a shop, someone has to decide what goes on which shelf. lowerSpendings has no shelves and no stock, only listings from dozens of Australian stores, each filed its own way. This is how we turn them into something you can browse, and how we check whether we got it right.

By Michael Leaney, Founder of lowerSpendings
· 11 min read
Take one camera, the Insta360 X5. Three of the stores we track sell it. Camera House files it under “360”. Mobileciti puts it under “For Him”. Banggood lists it under “Automobiles & Motorcycles”.
None of them is wrong, exactly. Each category is there to suit the store's own website, and a gift guide or a car-accessories section is a perfectly good place to sell a camera. But if you want to see every 360° camera in one place, a list of 360° cameras has to come from somewhere else.
Multiply that by the whole catalogue. When I checked the production database for this article, it held 612,281 offers: one offer is one store's listing of one item, with its own price and link. 407,709 of them had been seen in the last five days, from 62 stores. Between them, those live offers carry 21,117 different store categories, and 26,188 of them have no store category at all.
So every offer arrives as, at best, a title, a description, a price and a label that only makes sense on the store's own site. To make a catalogue out of that, we answer two questions, one after the other.
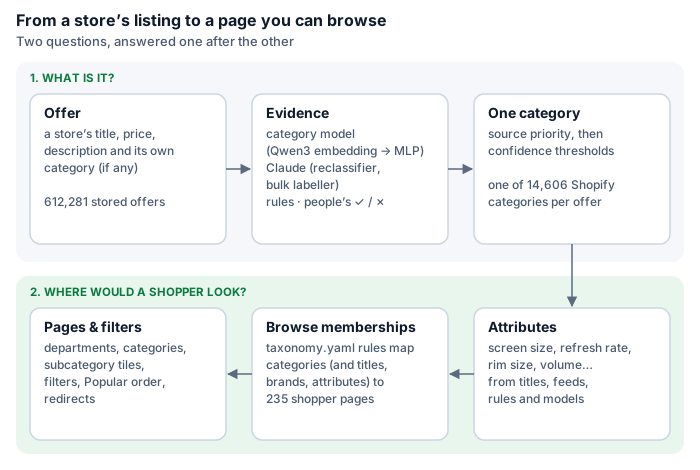
Question one: what is it?
A very big tree
For “what is it?”, we use the Shopify Product Taxonomy, an open list of product categories maintained by Shopify. The release we use has 14,606 categories, up to eight levels deep. “Electronics › Cameras & Optics › Cameras › Digital Cameras › 360-Degree Digital Cameras” is a single entry.
That's far more detail than any shopper wants in a menu, and that's the point. A fine-grained, shared vocabulary lets us be precise about what a thing is without deciding yet how to present it. It also gives every category a stable identifier, the same in every copy of our database, so labels and models can refer to it reliably. Today's live offers use 3,682 of those categories.
Evidence, not answers
Nothing in our system simply declares an offer's category. Instead, each source of information leaves a label: “I think this offer is a 360-degree camera, and I'm this sure.” The category an offer actually shows is chosen from those labels. There are several sources:
- The category model. This is our own. A text-embedding model, Qwen3-Embedding, turns an offer's name, brand, store category and description into a list of 1,024 numbers that captures its meaning. A small neural network (strictly, three of them trained the same way, with their votes averaged) reads those numbers and gives a probability for each category. It's fast and cheap enough to run on every offer, every time its text changes.
- The reclassifier. When a person on our side marks an offer's category as wrong (a ✗ in our review tools), Claude, a large language model, is asked to choose again. It's shown a short tree of candidate categories (the model's top ten, the categories whose names are most similar to the offer, and their neighbours), with the branches numbered as well as the leaves, so “it's clearly a camera accessory, but none of these leaves fit” is an answer it can give.
- The bulk labeller. A scheduled job, with a daily budget of a few dollars, asks Claude about offers that no person has looked at. A smaller, cheaper Claude model gives a first opinion. If it agrees with our model, that's the label; if not, a larger model decides. Seven in ten offers it picks are the ones our model is least sure about; the rest are chosen at random, so we can judge the job's accuracy without only ever testing it on the hard cases.
- Rules. Some mistakes are systematic: a store files every van and motorbike tyre under “Vehicles”, or industrial magnets come out as craft magnets. For those we write an explicit, reviewed rule. There are 1,661 rule labels at the moment, almost all of them tyres and magnets.
- People. Ticks and crosses from our own reviews. The system also has a place for shoppers' reports, which we'd review before they count, though there's no button for sending one on the site yet.
Choosing one
When the labels disagree, the order is fixed. A person's decision wins, then an accepted shopper report, then a rule, then agreement between several labellers, then a confident Claude label, then two older labelling runs we imported, and last of all our model.
In practice the model still decides most offers, because it's the only source that sees all of them: 369,668 of the 407,709 live offers, or about 91%, show the model's pick.
There's one more rule. When the model's best guess has a confidence below 0.5, we call it uncertain. Uncertain offers still appear in search and on category pages, but they don't count towards the numbers that decide whether a page exists, and our “Popular” ordering puts them last. About 70,000 live offers are uncertain today.
Measuring it honestly
It's easy to fool yourself with a model like this. If you test it on offers it was trained on, it looks brilliant.
So the labels people give us are split once, for good: 40% go into a frozen test set and are never used to train anything, from any source. The split is decided by a hash of the offer's identifier, so it can't drift or be tuned. Every night an evaluation job scores each model version on that test set.
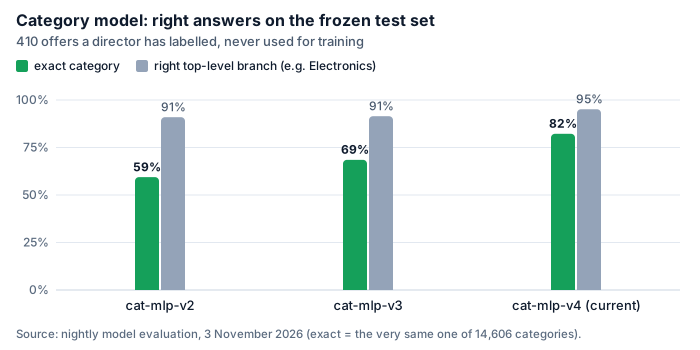
The current version gets the exact category right for 82% of those 410 test offers and the right top-level branch, such as Electronics or Home & Garden, for 95%. That's a real improvement on version 2's 59%, and an honest one, but it comes with caveats. The test set is small, and it's made of offers a person chose to look at, which tilts it towards the tricky ones. Much of version 4's gain came from offers near newer human labels; on test offers far from anything it was trained on, it was barely better than version 3.
What a confidence means
Every label carries a confidence between 0 and 1, but a number is only useful if it means something. “0.85” should mean “right about 85% of the time”.
Whenever someone ticks or crosses an offer's category, we record which source put that category there and how confident it was. Grouped into bands, that shows how far each source's confidence can be trusted.
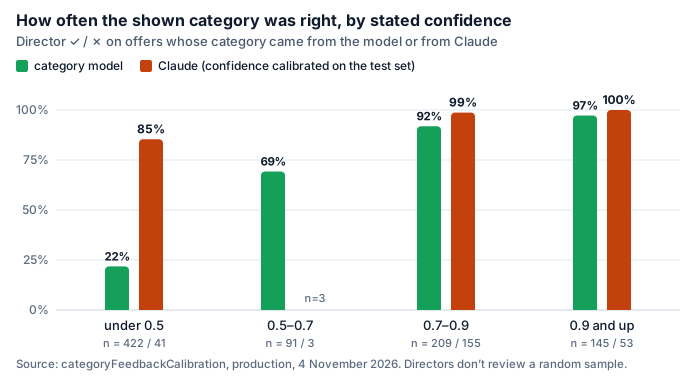
The model's confidence behaves roughly as it should: high confidence is usually right, and below 0.5 it's right only about one time in five. That's why uncertain picks don't count towards a page.
Claude's labels don't store the confidence Claude states. Language models are notoriously over-confident about their own answers, so we measured how often its answers were right at each stated confidence on the test set, and the label stores that measured rate instead. By that measure, a stored 0.9 or more is about 97% precise.
The torch that was a charger tip
For a while, though, the rules left an obvious gap. A bulk Claude label only applied at 0.9 or more. Below that it was evidence, and the model's pick stayed, however unsure the model was.
One offer shows the problem well: a “Targus PT-3N 3-Pin Power Tip”, the swappable plug for a laptop charger. Three versions of our model had a go at it. One thought it was a soldering-iron tip (confidence 0.03), one a pen tablet (0.05), and the current one a handheld torch (0.02). Claude said Replacement Charger Tips & Connectors, at 0.85. The torch stayed.
The data made the case for a change. When we compared the two on production at the time, people had confirmed 5 of 42 of the current model's picks below 0.5 (12%) and 43 of 43 bulk Claude labels between 0.7 and 0.9. Since 4 November, a bulk Claude label at 0.8 or above replaces a model pick that is less confident than it, unless a person has already rejected that category for the offer. It never overrides a person, a rule or a stronger source.
On a copy of production the day before it shipped, the rule changed the source of 737 offers and the category of 487 of them. Today 1,259 offers show a category from such a label. They also stay in the review queue, because 0.8 isn't certain. The Targus tip has since been confirmed by a person, and it's a charger tip again.
Question two: where would a shopper look?
A good classification doesn't make a good shop. To find a phone through the Shopify tree, you'd go Electronics › Communications › Telephony › Mobile & Smart Phones › Smart Phones. A shopper expects Phones & Tablets › Smartphones.
So, since this week, the site has a second tree, written for shoppers: the browse taxonomy. It has 15 departments, 205 categories, nine “landing” pages (such as iPhone, or refurbished phones) and eight link tiles that point to a page elsewhere. It lives in one human-readable file in our code repository, and every change is compiled into a database migration and reviewed like any other code.
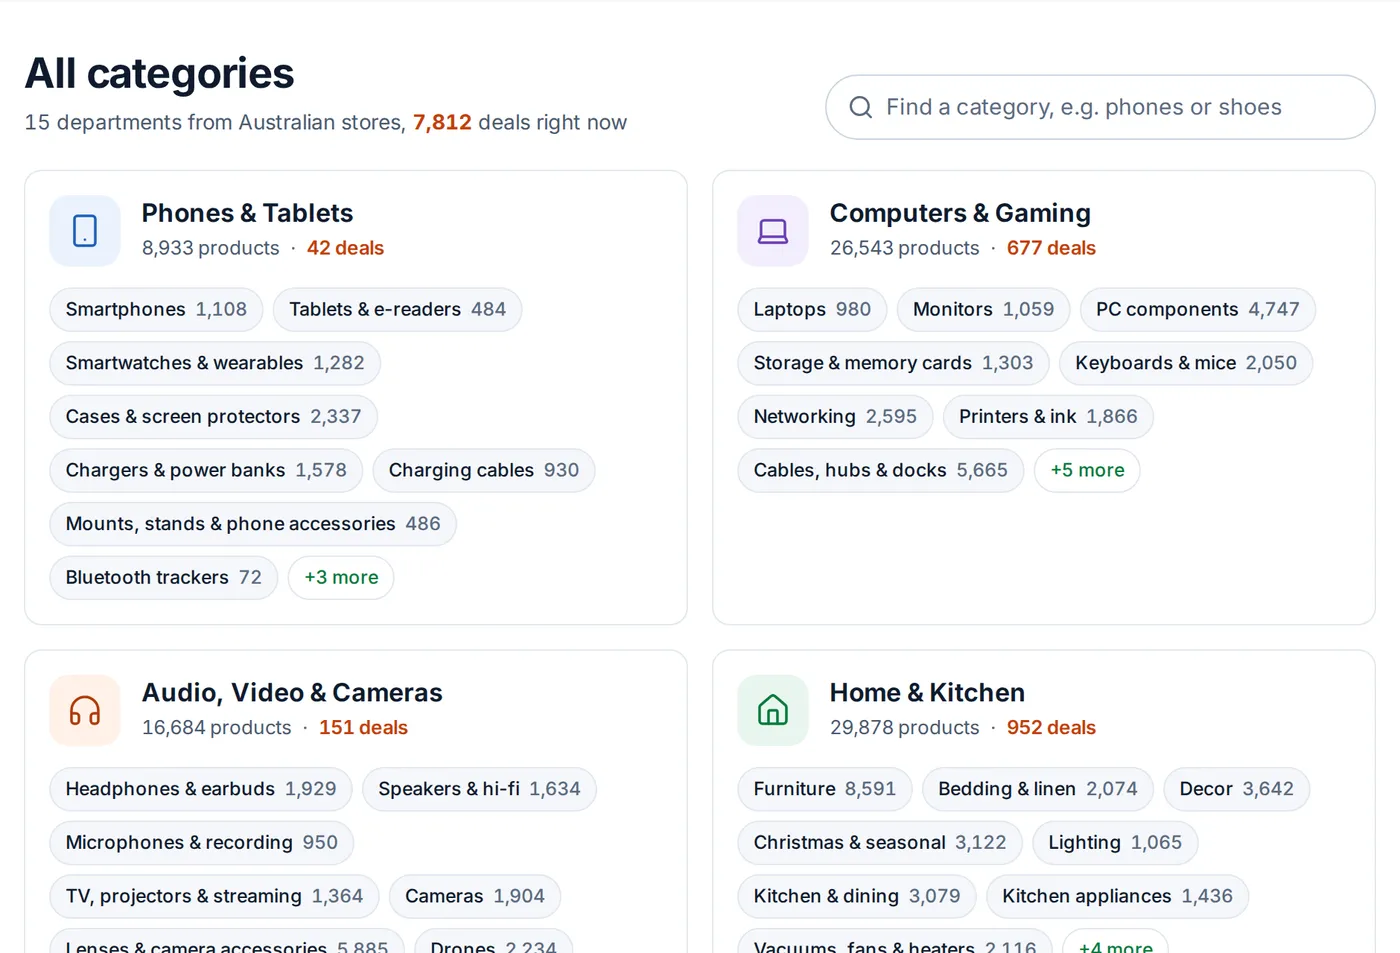
Pages don't hold offers directly. Each one has rules: mostly “these Shopify categories belong here”, sometimes narrowed by words in the title, a brand or an attribute. The rules are applied to every catalogue product (the item sold across stores, with each store's offer attached) and kept up to date as offers change. One product can be on several pages; a gaming monitor belongs on Monitors and on Gaming. When two rules both want it as their main home, the more specific Shopify category wins, which is how a child page carves its products out of a parent.
When does a page deserve to exist?
Every page has to earn its place. We count its listings, the product cards you'd see on it (sizes and colours of one product share a card), leaving out uncertain category picks:
- from 50 counted listings, it gets a page;
- from 100, search engines are invited to index it;
- from 150, it appears in the menus.
A page below 50 sends visitors on to its parent. 235 pages qualify at the moment. Where an old page from the Shopify-based site maps cleanly onto a new one, it redirects permanently, so existing links and search results keep working. There are 75 such redirects so far.
What comes first
A category page with thousands of products needs an order before anyone sorts it. Ours, “Popular”, puts first what's most useful to compare: listings sold by four or more stores, then three, then two. Within each of those tiers, known brands lead, and “known” is worked out per page from how many of the page's stores and listings each brand has. Phones lead with phone brands and cables with cable makers, rather than whichever brand is biggest across the whole site. Today's price is the tie-breaker, and uncertain category picks go last. Brands can't pay for placement.
Subcategory or filter?
Once there were pages, the next question was how to narrow a big one down. We settled on one rule:
- Different kinds of thing → subcategories. If a page's listings spread over several Shopify categories that each have enough listings for a page of their own, each gets a child page.
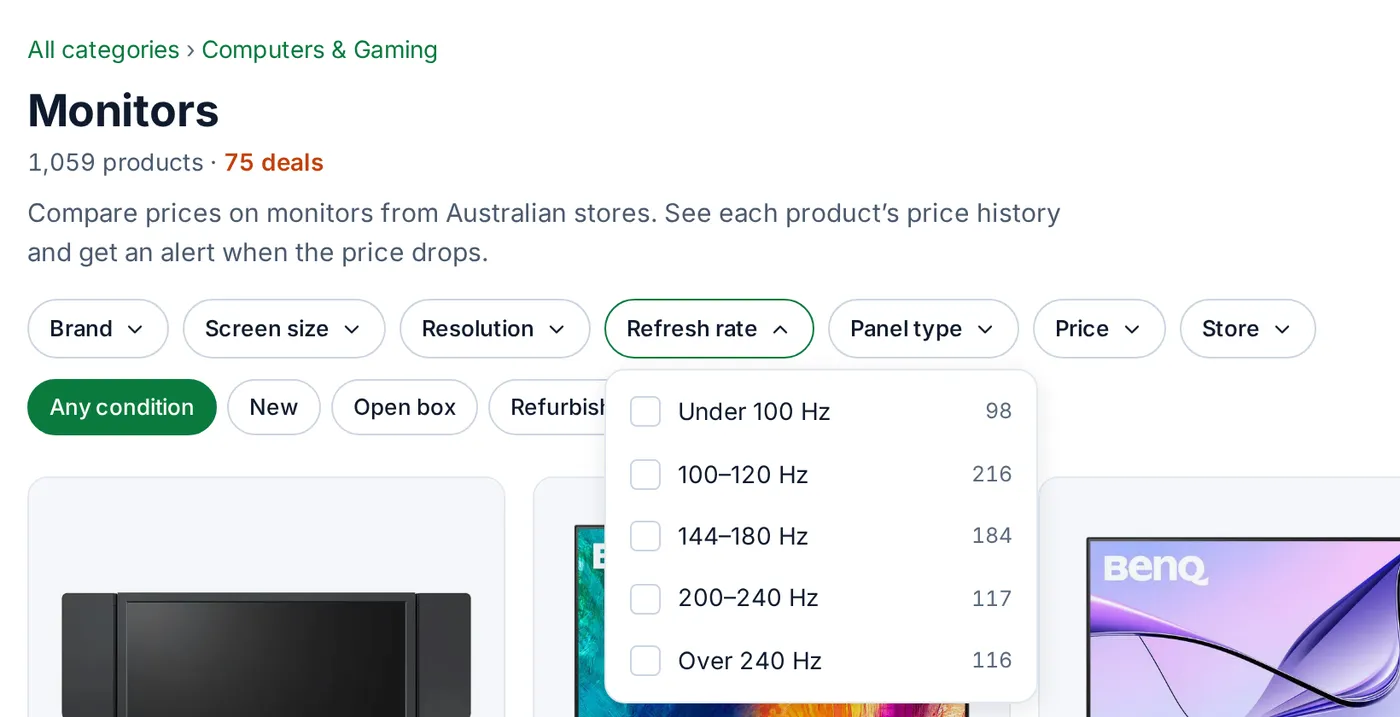
- One kind of thing, varying in a property → filters. Monitors are all monitors; they differ in screen size, resolution and refresh rate. That's a filter, not six pages.
PC components was the clearest case for splitting. With about 4,800 products, it was really nine different kinds of thing: cases, fans, coolers, memory, power supplies and so on.
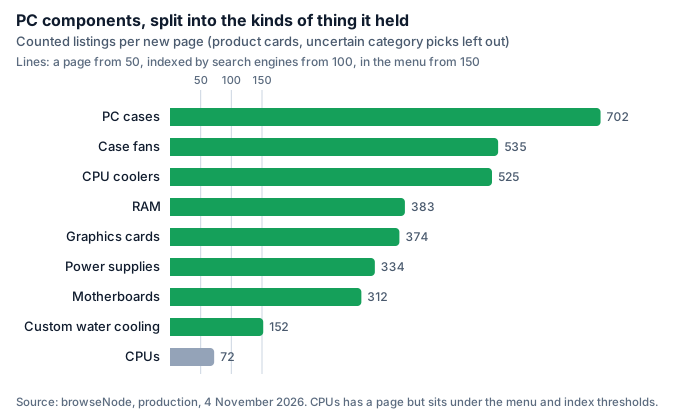
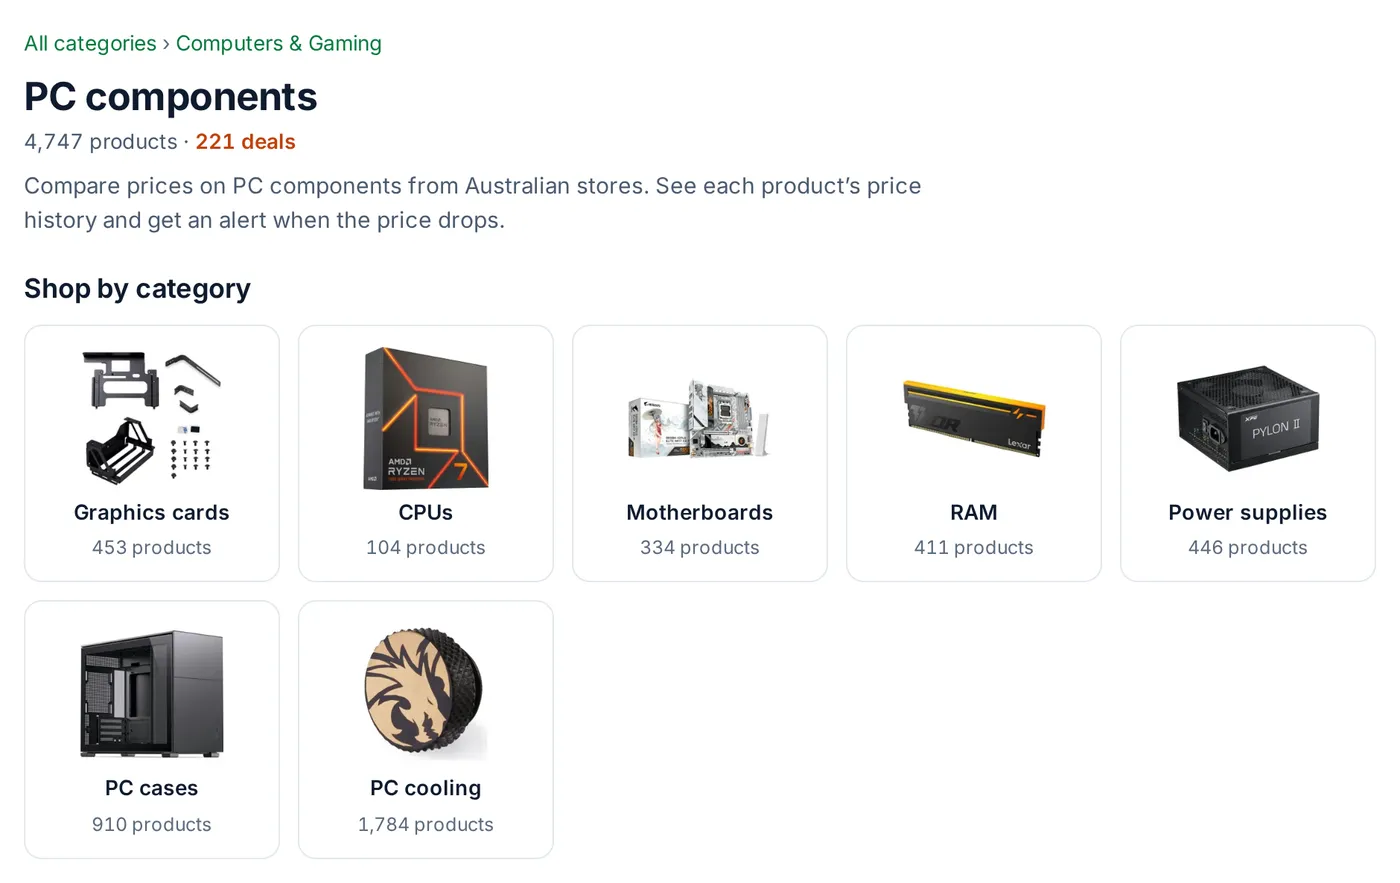
Later rounds split ten more large pages, including chargers and power banks, storage, keyboards and mice, cables, cameras and furniture, and gave Bluetooth trackers a page of their own. That last one is a judgement call rather than a threshold: trackers have only 72 listings, but they're something people go looking for, so we put the page in the menu by hand. The thresholds are defaults, and we can say so when we disagree with them.
Filters need attributes
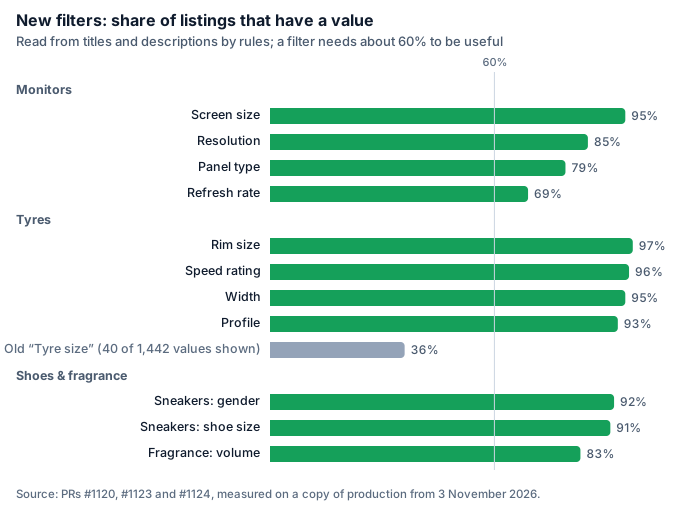
A filter is only as good as the data behind it. When we looked at Monitors, screen size was already well covered, but the things monitor shoppers compare next weren't there at all. The stores state refresh rate, resolution and panel type in their titles; none of it had been pulled out into a field.
So we wrote extraction rules that read the titles and descriptions the way a person would. “1440p” on a 34-inch screen means an ultrawide 3440 × 1440 panel; “4K 160Hz / 1080p 320Hz” on a dual-mode monitor means 160 Hz at its native resolution. Refresh rates come in about 35 different values, so the filter groups them into five bands where stores' numbers cluster.
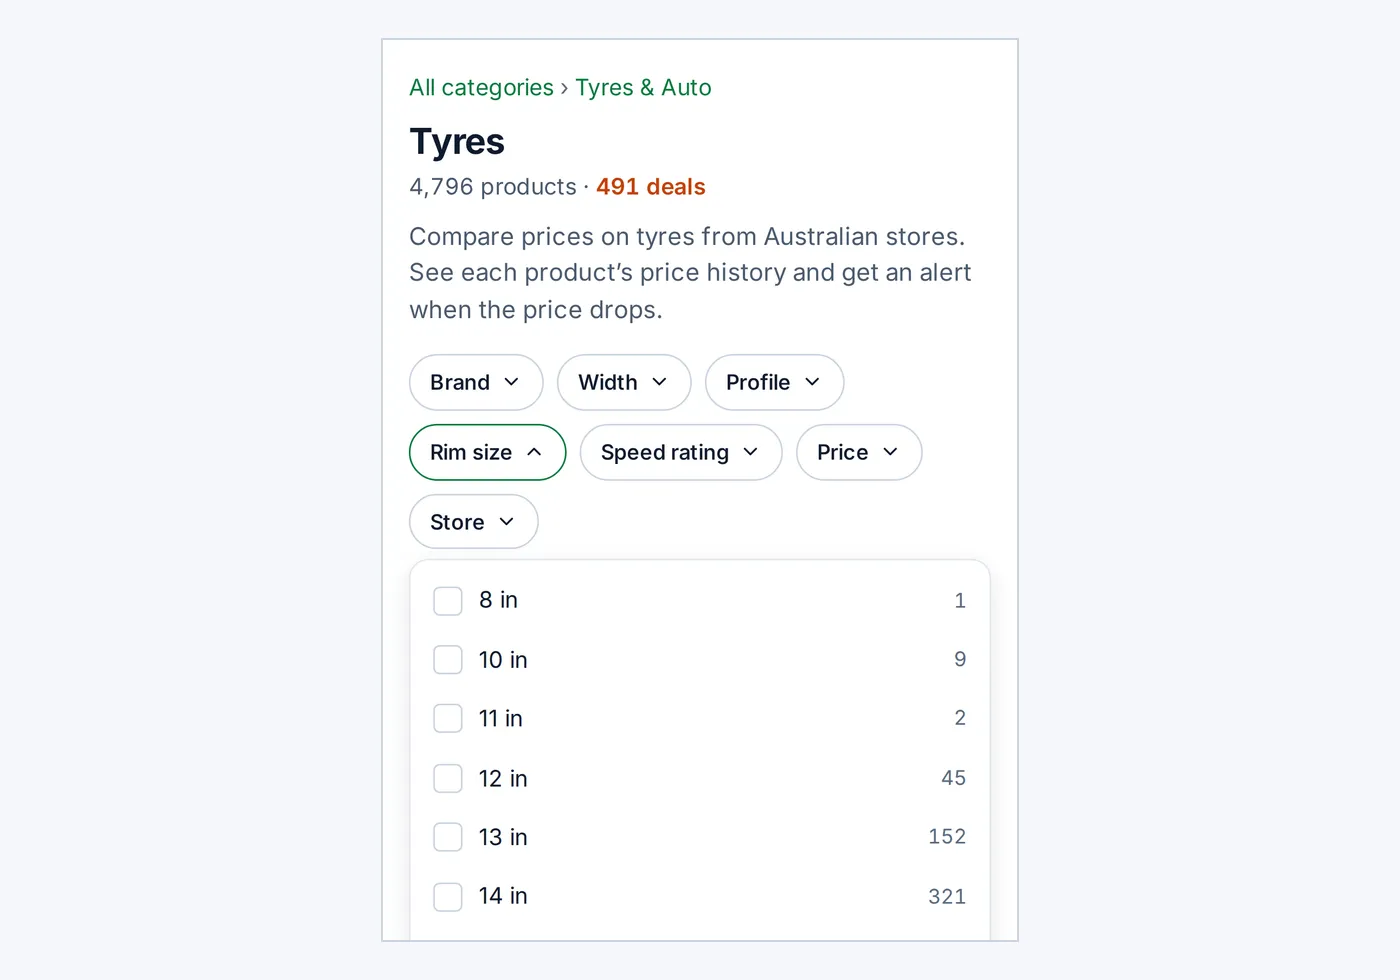
Tyres had the opposite problem: too much detail. Its single “Tyre size” filter had 1,442 different values, and the 40 it could show covered only 36% of listings. Tyre shoppers read the size off the tyre they already have, as width, profile and rim, so we split the size into those three and added the speed rating.
Fragrance volumes arrived as “100.0”, “100 ml” and “1.7” (fluid ounces), and are now shown in millilitres, so 1.7 oz joins the 50 ml bottles. Shoe sizes written “9.5 US” and “US 9.5” are now one value. A filter goes on a page once roughly 60% of its listings have a value.
A report that proposes the next step
Doing that audit by hand for every page doesn't scale, so it's now a report. For every page with at least 50 listings, the taxonomy organiser shows how the page's listings spread over Shopify categories, which subcategories would clear the thresholds, which attributes would make good filters and how many listings have them, and what looks wrong.
On a copy of production from 3 November, it covered 220 pages and made 61 split proposals. For 66 pages, the useful attribute is there in principle but too few listings have a value yet. It also flags things that point back to classification. For example, the “TV, projectors & streaming” page had only six televisions on it, which says more about how TVs were being categorised than about the page.
The report proposes; a person decides. Each accepted proposal becomes a small, reviewed change to the taxonomy file, with the before-and-after numbers in the pull request.
What's next
- More splits and filters, page by page, from the organiser's proposals.
- Filling attributes. Rules reach a long way on monitors and tyres, but not on watches, where few titles state a case size. That's work for the bulk attribute labeller and for store-specific parsing.
- Shopper signals. So far every decision here comes from the catalogue itself. Once there's enough traffic, searches that find nothing and the categories people actually click on will tell us where the tree is still wrong.
The two questions stay separate. “What is it?” should be answered once, as precisely as we can, with the evidence kept and measured. “Where would you look?” can then change as often as shoppers need it to, without touching any of that.
Catalogue figures are from the production database on 4 November 2026, unless a caption says otherwise. Accuracy figures come from our nightly evaluation on the frozen test set and from people's ticks and crosses; both are small samples, chosen for review rather than at random, so treat them as indications rather than catalogue-wide accuracy. Screenshots are of the live site, signed out.