

100 stores and counting. What more stores mean for your comparisons.
When lowerSpendings went live on 27 October, it covered 53 stores. On 17 November it passed 100, and today it covers 113. That's a milestone worth a few charts, and a chance to show what more stores actually change for you.

By Michael Leaney, Founder of lowerSpendings
· 5 min read
From 53 stores to 113 in three weeks
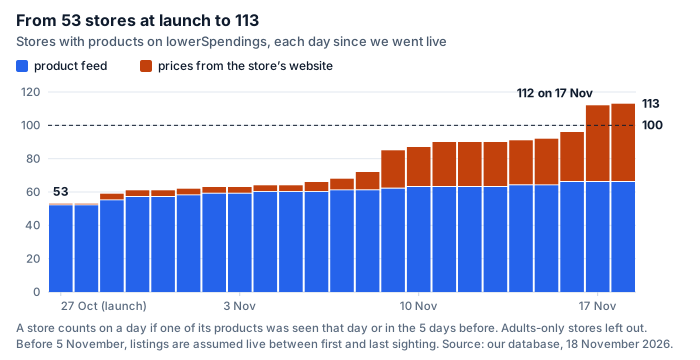
For the first ten days, growth was steady: about a store a day, most of them smaller online stores that send us a product feed. Then, from early November, we started adding the big names, and the count jumped. JB Hi-Fi and The Good Guys arrived on 6 November, Target and Chemist Warehouse on the 8th, David Jones and Officeworks on the 9th, Myer and Big W on the 11th and Kmart on the 15th.
The biggest single day was 17 November, when 16 stores joined at once, including Autobarn, Petbarn, Baby Bunting, Bed Bath N' Table, Macpac and TerryWhite Chemmart. That took us from 96 stores to 112. Every one of them is on Stores we compare, along with whether we earn a commission from it and how fresh its prices are.
Two ways we get prices
Of the 113 stores, 66 send a product feed through an affiliate network: a file with every product, its price and usually its stock, which the store keeps up to date. Most of the stores we launched with work that way.
Many large Australian stores don't publish a feed. For 47 stores, we read the prices from the store's own website instead, carefully and at a modest pace. Of the 62 stores we've added since launch, 46 are this kind. These 47 stores list about three quarters of the 1.49 million offers on the site today. (An offer is one store's listing of one product.) It's more work for us, but it's the only way to include many of the stores people actually shop at.
Products you can compare: 1,130 to 58,986
More stores means more products: 846,910 today, up from 229,456 at launch. But the number I care about most is a different one: how many products you can buy at more than one store, because that's when comparing prices actually helps you.
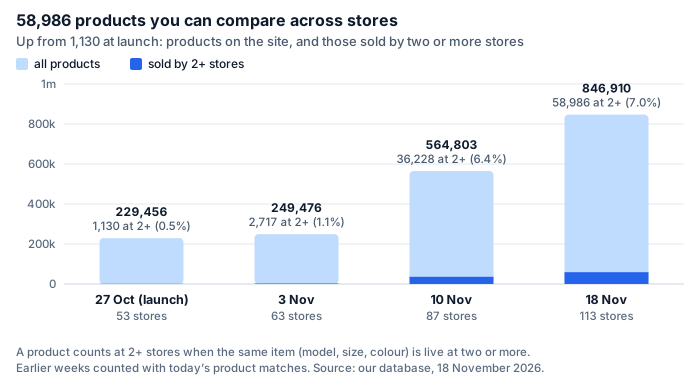
At launch, only 1,130 products were sold by two or more of the stores we covered. Today it's 58,986, over 50 times as many. The number of products grew about 3.7 times; the number you can compare grew far faster, because the stores we added overlap with each other. A small store with its own range adds products. A big department or electronics store adds products and comparisons, because many of the things it sells are sold somewhere else too.
Counted as individual items (the same model, size and colour), 73,403 are now sold by two or more stores, and 37,654 by three or more. Some are now at ten of the stores we track, such as the Apple Pencil (2nd Gen), listed from $198 to $219 today, and the Samsung Galaxy Tab A11+ (128GB, grey), listed at $299 at one store and $479 at four others. Prices change, of course, but that's the kind of gap a comparison is for.
What's covered
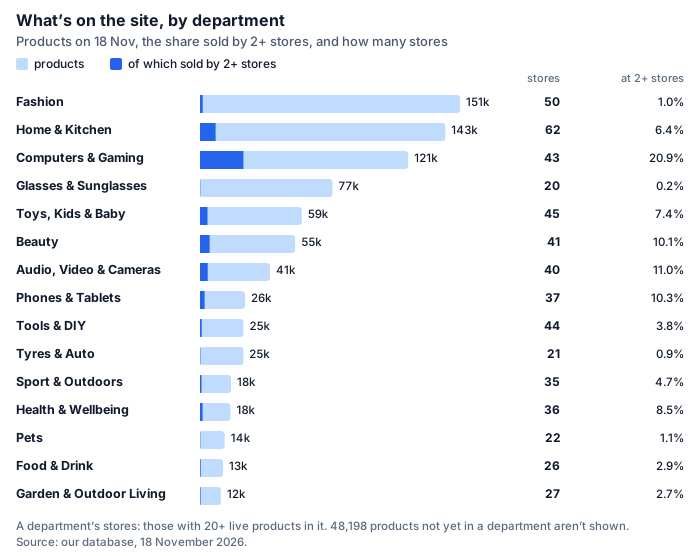
A few things stand out:
- Home & Kitchen has the most stores: 62 stores have at least 20 products in it, from department stores to furniture and appliance specialists.
- Computers & Gaming is the easiest place to compare. One product in five there (20.9%) is sold by two or more stores, three times the site-wide share. Computer stores tend to sell the same brands and models.
- Fashion has the most products but the fewest comparisons (1%). Clothing ranges are often a store's own, and the same item is hard to find elsewhere. Glasses & Sunglasses is similar: most of its products come from a few specialist online stores.
- Tyres & Auto has 25,229 products but few comparisons yet (0.9%). Autobarn only joined on 17 November, and that share should grow as more auto stores do.
Prices we've recorded
Every time we see a new offer or a price change, we record it. Since price tracking restarted on 22 October, that's 2.62 million price records, 786,538 of them changes to a price we'd already seen. Those records are what each product's price history and our deal labels are built from, so more stores also means more histories you can check before you buy.
What's next
More stores, and especially more of the stores you already shop at. Each one adds products, but the real gain is in comparisons: the more stores sell a product, the more likely you'll find it cheaper somewhere.
What this doesn't show
- Three weeks of history. The site went live on 27 October, and before 5 November we only know when each listing was first and last seen, so for those days we assume it was listed throughout. Store counts are hardly affected; daily product counts in that period are estimates.
- Today's matches, applied to earlier weeks. We count the products at two or more stores with the matches we have today. Matching has also improved over these weeks, so at launch the site itself showed somewhat fewer comparisons than the chart's earlier bars suggest.
- Two stores have left. Two of the stores we launched with no longer have products on the site: 53 at launch, plus 62 added, minus those two, makes 113.
- Not every product is in a department yet. 48,198 products aren't in one of our departments yet, so they're not in the department chart.
How we counted. Figures are from our production database on 18 November 2026 (Perth time). A store counts on a day if at least one of its products, at a price above zero, was seen in the store's feed or on its website that day or in the five days before, the same rule the site uses to decide what to show; adults-only stores are left out, as on Stores we compare. A product is what the site shows as one card: a product line, with its sizes and colours together. A product counts as sold by two or more stores when at least one of its items (the same model, size and colour) is on sale at two or more stores; MSY and Umart, which share most of their range, count as two stores (155 items are at those two and nowhere else). A department's stores are those with 20 or more products in it. The queries, a second set of independent queries that check them, and the scripts that draw the charts are in our code repository.