

Are prices creeping up before Black Friday? Mostly not, and the store matters more.
Every year someone warns that stores quietly raise their prices before Black Friday, so the "sale" price is no saving at all. We now track over a million prices every day, so I looked at what actually happened from 26 October to 17 November. The short answer: most prices didn't move, and the bigger saving was usually in choosing the store.

By Michael Leaney, Founder of lowerSpendings
· 9 min read
Before the numbers, the limits. We restarted price tracking on 22 October, so this is under four weeks of history, not three years. In those weeks, 60 of the stores on lowerSpendings were tracked from the start; most of the big names we've added since, such as David Jones, JB Hi-Fi, Myer, Big W and Kmart, have only been tracked since early or mid November, so they're missing from the week-by-week view. And Black Friday itself (27 November) hasn't happened yet. This is the before picture.
Most prices didn't move at all
To compare like with like, I took the 323,162 offers we saw every day across the three full weeks from 26 October to 15 November, from 49 stores, and asked one question per week: did the price end the week at least 1% higher, at least 1% lower, or about the same? (An offer is one store's listing of one product.)
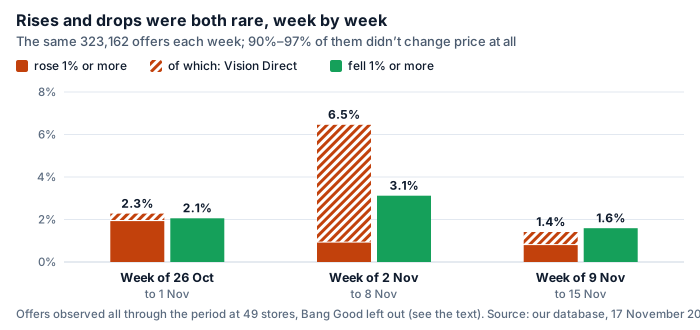
In a typical week, about one price in fifty went up and about one in fifty came down, and 90% to 97% didn't change at all. When prices did move, drops were the bigger moves: the typical drop was 10% to 13%, the typical rise 5% to 10%.
The one week that looks different, starting 2 November, is mostly one store. On 2 November, 17,682 of Vision Direct's prices went up, by a median of 5.8%, almost all of them glasses and sunglasses. Leave Vision Direct out and that week looks like the others, with more prices falling (3.5%) than rising (1.3%).
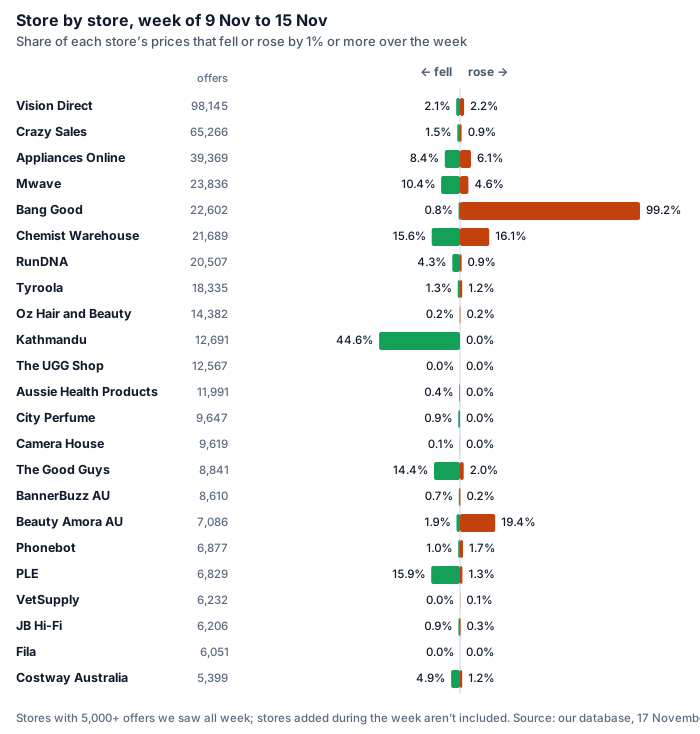
I've also left one store out of the chart altogether. Bang Good's prices move almost every day, in small steps in both directions: a median of 12 changes per product between 2 and 17 November, each typically about 0.5%. In the week of 9 November nearly all of them (99%) ended the week higher, by a median of 2.4%. Mixing that pattern in would make the chart about one store's daily movements rather than the market.
Split by department, nothing else stands out. Glasses and sunglasses (the Vision Direct week) and pet supplies (in the week of 26 October) are the only departments where more than one price in fifteen rose in any week, and in both cases almost all of those rises were at one store.
Store by store, the latest full week had more cuts than rises. A few stores cut a large share of their prices: Kathmandu 45%, PLE 16%, The Good Guys 14% and Mwave 10%. Apart from Bang Good, the stores where many prices rose were Beauty Amora AU (19%) and Chemist Warehouse (16%, where about as many fell).
Price cuts at stores we've only just added
Some of the stores we added in November have been cutting prices since we began tracking them. At JB Hi-Fi, 7% of the 47,514 products we could follow were cheaper on 17 November than when we first saw them, by a median of 15%; at The Good Guys, 14% were cheaper, by a median of 20%. Few had gone up (1% at JB Hi-Fi, 2% at The Good Guys).
I can't tell you whether those prices were higher in October, because we weren't tracking those stores then. That's exactly the kind of claim our deal labels won't make: a price only counts as a "was" price on lowerSpendings after we've seen it for at least seven days.
David Jones is a different case, and its cuts shouldn't be read as a Black Friday sale. On 5 November David Jones entered voluntary administration, and its stores and website have kept trading while a sale or recapitalisation of the business is sought. We began tracking David Jones on 9 November, so every David Jones price we have is from after the administration began. Of the 259,331 David Jones products we saw on both 9 and 17 November, 25% were cheaper on the 17th, by a median of 30%, and fewer than 2% were dearer. The cuts came in several rounds, the largest on 13 November (about 21,000 prices down) and on 14, 16 and 17 November (13,000 to 15,000 each). Their timing lines up with the administration, not with Black Friday, and we have no David Jones prices from before it to compare them with.
David Jones isn't in the week-by-week figures, the October comparison or the "already at a low" figures below at all, because we weren't tracking it then. In the store comparison it's the cheapest store, or tied for cheapest, for 2,170 of the 2,933 products it shares with another store; leaving it out changes the typical gap only slightly, from 8.8% to 9.2%.
Prices that rose after a quiet October
Here is the pattern people worry about: a price that sits still, rises a few weeks before the sales, then comes "down" to where it was. To have something to check after Black Friday, I counted the prices that held still in late October and then rose in November.
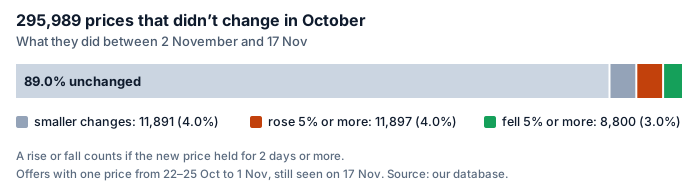
Of 295,989 offers with one unchanged price from late October to 1 November, 11,897 (4.0%) rose by 5% or more in November, and 11,263 of those were still up on 17 November. Over the same weeks, 8,800 (3.0%) fell by 5% or more. Three quarters of the rises (8,964) were at Vision Direct, from the change on 2 November.
A price rise isn't wrong in itself: costs change, and so do prices. What matters is whether a Black Friday price is really lower than what you could have paid in October. After the sales I'll look at these 11,897 prices again and report what I find, whichever way it goes.
Where you buy often matters more than when
The biggest differences in November weren't between weeks. They were between stores. I took every product sold new at two or more stores that you could actually buy on 17 November (in stock as far as we know, with a current price): 31,155 products. For each, I compared the cheapest store with the dearest.
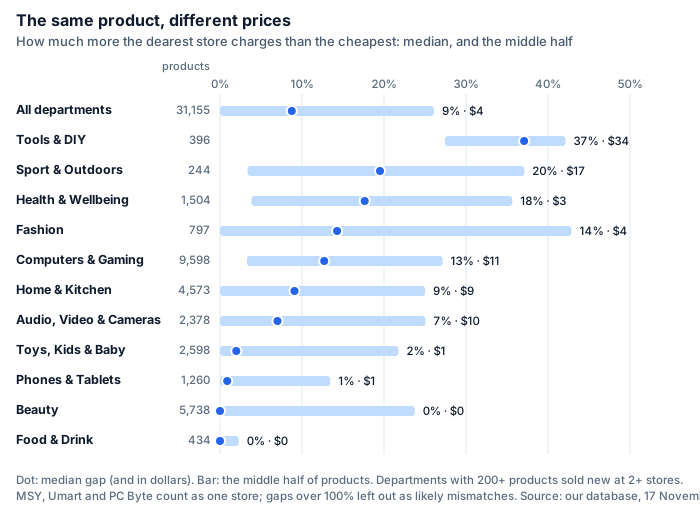
The typical gap was 8.8%, or about $4. For the middle half of products it was between 0% and 26% ($0 to $21). A third (33%) cost the same everywhere, while 32% were at least 20% dearer at one store than another. Products sold at three or more stores had a typical gap of 16%, or $13.50.
Many of the products sold at exactly two stores are sold by two stores with the same owner and largely the same prices: Kmart and Target list the same price for 95% of the products both sell, and JB Hi-Fi and The Good Guys for 57%. Counting Kmart and Target as one store, the typical gap is 11%. The more stores sell something, the more it pays to compare.
A few products you might be shopping for, on 17 November:
- Ninja Slushi frozen drink maker, at 5 stores: $255 to $399.
- Logitech MX Keys S keyboard, at 6 stores: $139 to $229.
- Breville Bambino Plus coffee machine, at 5 stores: $477 to $629.
- Dyson HP00 Pure Hot+Cool fan heater, at 4 stores: $499 to $749.
- Nintendo Switch 2 Pro Controller, at 7 stores: $94 to $128.
Those prices will have changed by the time you read this; the point is the spread. Tools & DIY looks unusually wide because most of its shared products (255 of 396) are Vevor-brand items sold both by Vevor's own store and by Crazy Sales; without them, its typical gap is 14%.
Already at a low?
Of the 320,393 offers we've tracked since at least 1 November (Bang Good again apart), 81% have never changed price. Of the 57,844 that have, 22,615 (39%) are at the lowest price we've recorded, and 32,592 are at the highest. Fashion stands out: 6,029 of its 6,759 changed prices are at their lowest. With under four weeks of history, "lowest we've seen" isn't a strong claim yet, and we label it that way.
How to use lowerSpendings this Black Friday
- Check the price history. Every product page has one. If a "sale" price is the same as the price in October, it's not much of a sale.
- Set an alert. Tap Alert me on any product and tick "Email me when the price drops", and we'll email you when it does, at most once a day. Your alerts are all on Price alerts.
- Compare stores before you compare dates. A product's page lists every store we track that sells it, cheapest first. As the numbers above show, that's often where the money is.
- See the week's genuine deals. Black Friday deals lists each department's best price drops, checked against each product's own price history the same way: no "was" prices, no price that was raised just before the sale.
- Look at Best deals. Every category can be sorted by Best deals, for example Computers & Gaming, and the home page shows the biggest price drops. A drop only counts if the earlier price lasted at least a week; How we rank has the rules.
I'll come back to this after the sales with the after picture, including those 11,897 prices.
What this doesn't show
- Under four weeks of history. Tracking restarted on 22 October. Nothing here says anything about prices earlier in the year.
- Not every store, and not from the start. On 17 November we had 1,332,685 live offers from 109 stores. Only 60 stores (408,328 offers) were tracked from October, and they're mostly smaller online stores that publish affiliate feeds. Most of the big department and electronics stores arrived in November, and a few (among them Kmart, Amcal, TerryWhite Chemmart and PC Byte) only in the last days before this copy.
- Feeds and websites. For 43 stores, covering 942,527 offers, we read prices from the store's own website rather than a feed. Some of them we can only read every day or two, so a change can show up a day late.
- David Jones is in administration. It entered voluntary administration on 5 November, before we began tracking it, so its price changes can't be compared with its own earlier prices or read as Black Friday pricing.
- No Black Friday prices yet. Sales already under way before 17 November are included; anything after isn't.
How we counted. Figures are from a copy of our production database taken early on 18 November 2026 (Perth time); 17 November is the last full day in it, and the week-by-week figures cover the three full weeks to 15 November. An offer counts in a week if we saw it on the Sunday before, on the week's last day and on all but at most two days between; its change is the difference between those two prices. We left out offers whose price changed by more than 60% at once (most likely a feed error), prices older than the store's freshness limit, a price that lasted a single day and went back, and adults-only stores. "Rose" and "fell" mean by at least 1%; in the October section, by at least 5%, counting only prices that held for two days or more. Before 5 November we only know when each offer was first and last seen, so for those days we assume it was listed throughout. Store gaps compare the cheapest new, buyable offer at each store; MSY, Umart and PC Byte are counted as one store, because any two of them list the same price for at least 99.7% of the products both sell, and the 1,263 gaps over 100% are left out as likely matching errors. David Jones has been in voluntary administration since 5 November and was only tracked from 9 November; it's in the store gaps and the new-store figures only, and the text gives the store gap without it. The queries, a second set of independent queries that check them, and the scripts that draw the charts are in our code repository.